Tutorial on using the debugger in Node.js
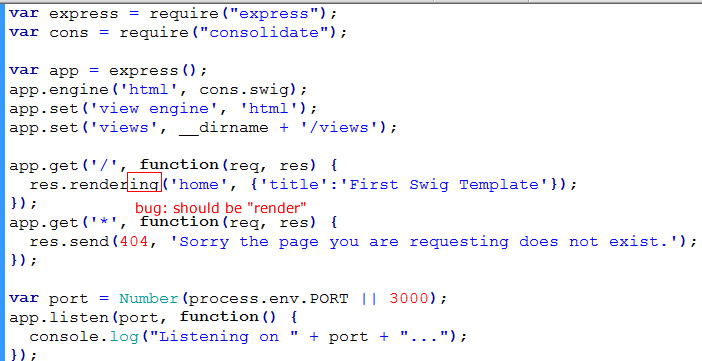
Let’s take the node.js application that we wrote in this tutorial and introduce a bug (typo) in the app.js file ….

bug in nodejs
When you run “node app.js” you get this error on the browser and console…

nodejs error
Using NodeJS Built in Debugger
You can use the built-in nodejs debugger by running …
node debug app.js
And you will get the nodejs debugger prompt at the console…

nodejs debugger prompt
Here are the common commands that you can type in the debug prompt …
cont – continue
next – run next statement
step – step into the next statement
out – step out of the current function
backtrace – show callstack
repl – start node REPL (Read-Eval-Print Loop) for interactive javascript and viewing variables
watch(expression) – add expression to watch list
list(n) – list the n lines of code around current line.
setBreakpoint(n) – setbreakpoint at line n
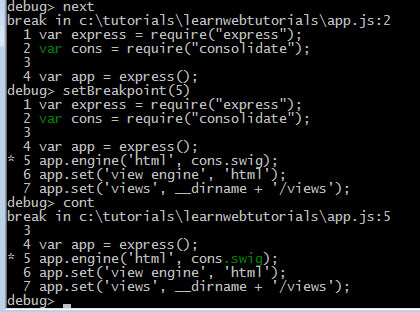
Here we show example, where we run next line, set breakpoint at line 5 and “cont” to that breakpoint…

node debugger in action
Next we start REPL, examine “app” and determined that it was a function, and view the value of “__dirname”…

nodejs repl in action
Ctrl-C to exit REPL.
Ctrl-C twice to exit debugger.


