Example of using the Chrome Developer tool for debugging
Posted in Tutorials


Today, I will show you an example of how you can use Chrome’s developer tool to help you debug and make changes to a website.
In this example, we have an WordPress site and we want to replace the green texture background image with another image.
Chrome Developer Tools
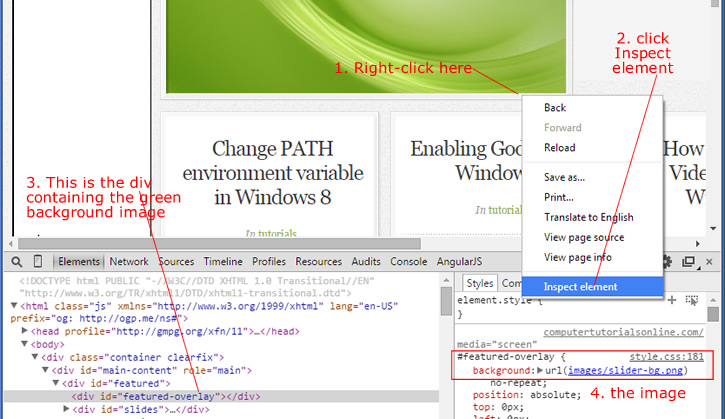
First we have to figure out where that green background image is. With the Chrome browser, we can right-click (or Ctrl-click if on Mac) on the element as shown above. This brings up a content menu, which you will select “Inspect element” menu item. This will bring up the Chrome Developer Tool. And in fact, it will highlight the HTML element that you have right-clicked on.
Now we know that the div of id=”featured-overlay” is the HTML element containing the background image.
When you have the element selected on the left panel of the Chrome developer tool, it will show the CSS properties of that element on the right panel of Chrome developer tool. And it even indicates that this CSS rule was defined in the style.css file.
In our case the background image file is “images/slider-bg.png”. But this is an “relative path” — relative to the style.css file in which this CSS rule is in.
But where is this style.css file. For WordPress, the style.css file would be in the WordPress theme folder and the theme folder is located in /wp-content/themes/
That’s complicated. An easy way to determine the “absolute path” of the slider-bg.png image is to hover over the blue image link…
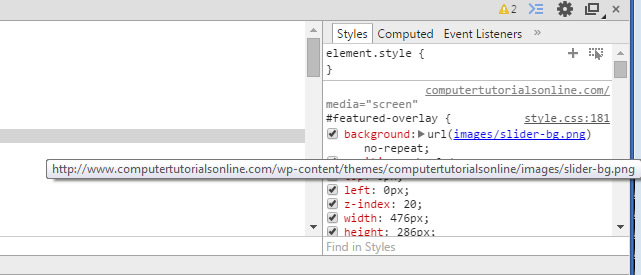
full path of background image
Now you see the full path.
To change the background image replace the image at that location with your new image. Ideally make it the same size as the original background image.
Related Posts
Tags
Share This